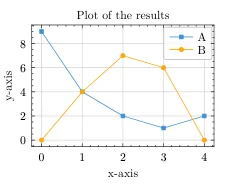
Sample Typst Plot
#lq.diagram(
title: [Plot of the results],
xlabel: [x-axis],
ylabel: [y-axis],
lq.plot(
(0, 1, 2, 3, 4),
(9, 4, 2, 1, 2),
mark: "s",
label: [A],
),
lq.plot(
(0, 1, 2, 3, 4),
(0, 4, 7, 6, 0),
mark: "o",
label: [B],
)
)